
Magick Eyes
A practical application of crystallography and Green's functions, and an analogy to charge ordering
The name ‘Magic Eye’ is a copyrighted name for an ‘autostereogram’. In this article I'll use the eccentric spelling Magick Eye and hope for the best. They were popular for a while during the early nineties, although there was only one I ever succeeded in doing back then (it was a rabbit). Here's a Magick Eye of a popular corn-based snack (you'll need to make the image full-size):

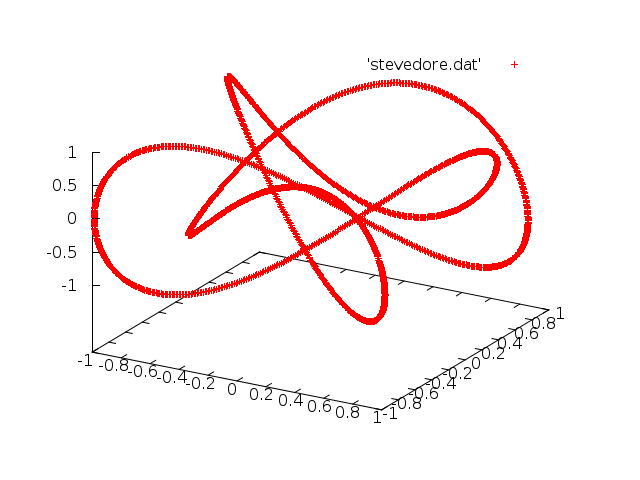
and another of a mathematical knot (for far too much information about knots in physics see the notes page from my talk):
The usual advice is to put your face close to the screen so your eyes can't focus on anything, cross your eyes a bit (made easier by the first step), then to pull back from the screen. When you ‘get’ the image it suddenly pops into view, suggesting some gestalt psychology is at work. I learnt to see the images by making them myself. I'll give a step-by-step guide to how to do this, in the (hopefully logical) order in which I did the work. I would like to thank John Hannay, whose advice was invaluable as always.
By understanding the method you should be able to write your own files. I have provided a tarball of the files I refer to in this article. Throughout this article I'll refer to the programs I used to do the various tasks, but any equally functional alternatives will be fine:
- A *NIX based operating system
- Inkscape (a Free and Open Source vector graphics program)
- GNUPlot (a Free and Open Source plotting program)
- A flask of weak lemon drink
- A Fortran 95 compiler (I recommend GNUFortran, because it's Free and Open Source)
Step 1: crystallography and charge ordering
We know that 3D vision is due to the two eyes seeing slightly different images (although there's a lot of perception involved as well). The most basic autostereogram can be made by drawing a 2D grid. The trick will be to cross the eyes so that both think they're looking at the same cell, but are in fact looking at different cells.
Drawing a grid on Inkscape is straightforward. Open a new file, set a grid by typing [shift]+3, then set the grid properties using [ctrl]+[shift]+d. I find a spacing of about 130 pixels is best in the x-direction (matching the spacing of the eyes). They y-direction doesn't matter so much, but the picture will be more exciting if you have different rows available to jump different distances. Press F6 to select the straight line tool, and fill in the grid. I've provided one in the tarball called grid.svg. Here's my grid:

Next you'll want to put an interesting picture in each cell (although this is not strictly necessary). The picture must be the same in each cell on a row, but as this is just going to be the background I recommend making all cells identical and not too exciting, so the eyes have an easier time believing the lie. I got a picture of some beautifully-coloured parrots and greyscaled them:
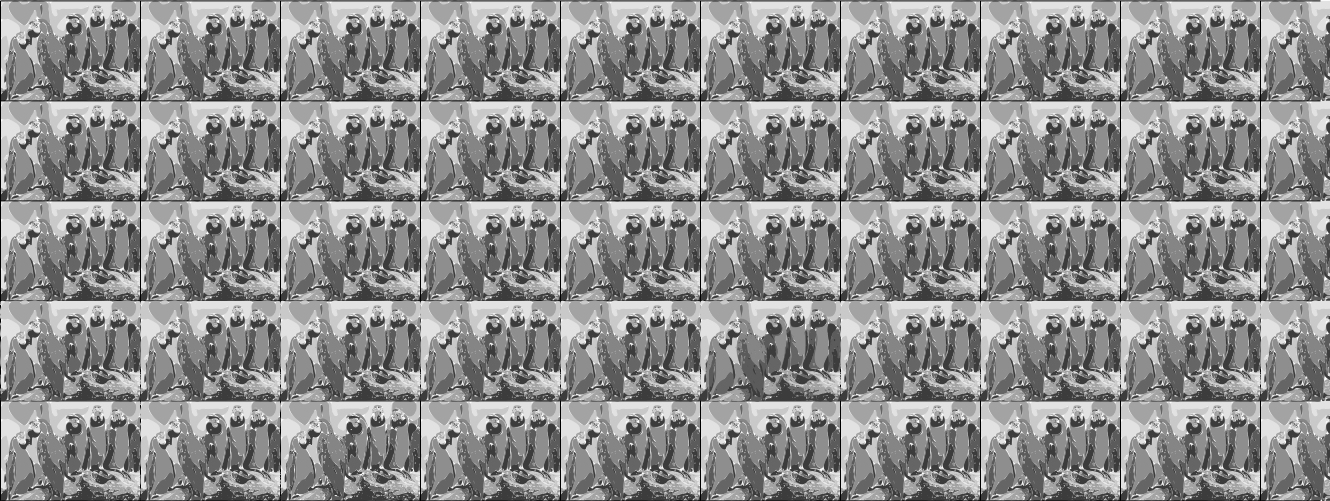
Unfortunately the file tends to be rather large because it contains many repeats of an image. Experiment with the grid .svg file and importing your own backgrounds. In crystallographic language the grid was your 2D crystal lattice, and the image you just chose was the basis or motif of the crystal.
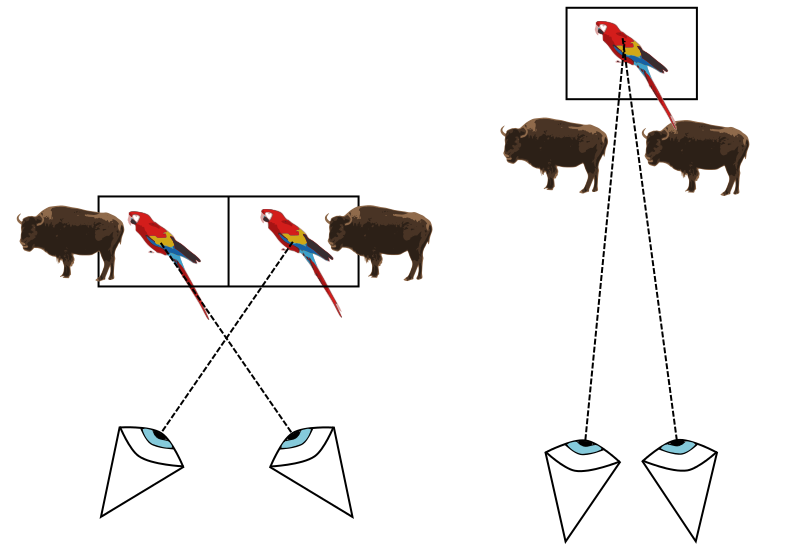
Now we'd like to add a second layer of images over the background, but crucially these will have a different spacing. In this image I've used buffalo and slugs with different spacings so that they jump either in front of or behind the parrots:

The addition of a second set of images with a wider spacing makes a nice analogy to charge ordering and charge density waves (see the Research page). In the analogy the crystal lattice would have a basis of atoms rather than parrots. The buffalo are like the electron field - at high temperature there's a buffalo with every parrot, but as the system is cooled suddenly the buffalo move apart in the x-direction, selecting a new period. They have spontaneously broken the symmetry of the crystal, by choosing to move in the x-direction rather than any other direction. In the magick eye case, of course, we chose this because your eyes are displaced in x rather than y.
Here's how the magick eye works: imagine looking at a set of rows of garden fences stretching off forever. The fence panels are uniformly sized, so you can tell how far away a row of fences is by how many panels you can see compared to one of the closest fence panels:
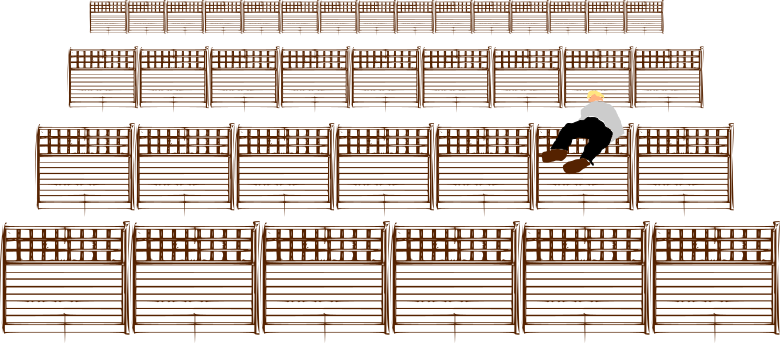
so your brain interprets closely-spaced fences as far-away fences. Now swap fence posts for parrots. By crossing the eyes we trick the brain into thinking both eyes are looking at the same parrot, whereas in reality they are looking at neighbouring parrots. Now add a layer of more widely-spaced buffalo. How does the brain fit these into its idea of what it's seeing? It thinks more widely-spaced things must be closer, so the buffalo must be closer than the parrots.
You need to repeat both animals. If you don't, one eye will see an image the other doesn't, and the brain will realise it's being fooled. It's interesting to try removing bits of your picture to see the effect.
Step 2: Green's functions
A lot can be learnt from the simple autostereograms just demonstrated. If you show them to someone, however, they'll complain that a magick eye is supposed to look like a computer-generated mess until you ‘get it’, at which point a rabbit jumps out of the page.
We can make buffalo and slugs jump out of or into the page by altering their spacing compared to the underlying lattice. Closer together means further away. Clearly the picture being made to jump is irrelevant - it's the operation of changing the spacing which does the work. So what if we make a single pixel jump? If we can do that, then we can build up an entire image pixel-by-pixel, choosing how far in or out of the page each pixel goes.
What we have in effect rediscovered is a Green's function, named after the fascinating character George Green. He taught himself maths, and lived in a windmill like Jonathan Creek - but whereas Creek solved hammy and implausible mysteries in the mid-1990s, Green solved differential equations in the mid-1820s. He realised that if you can find the effect of a differential equation on a single point (a delta function) then you have the general solution to the equation, since any function can be made by summing up single points. We have the Green's function for our transformation: take a point (pixel), repeat it with the lattice spacing, then squash the set of pixels together to move the effective pixel into the page. We therefore have the general solution to the question of how to add 3D data to a 2D image, as a 2D image is just a sum of all its pixels.
To make a standard magick eye, then, we need a data file with a list of 3 co-ordinates of each point in the 3D space. We then write a program which takes those points, and applies the following transformation:
- leave the y co-orindates fixed
- tile the x co-ordinate with fixed spacing (around 130 pixels)
- shift the tiled x copies according to the z co-ordinate.
Loosely, then,
y' = y
x' = x + a + z
where primes indicate transformed co-ordinates and a indicates a shift through the lattice spacing (carried out multiple times to tile the pattern). What do we take as the background, though? The points will look fairly periodic but with the repeats being shifted left and right. We need a background of regularly spaced pixels to help the eyes pick out the period and to disguise the image. The best option is simply a random distribution of points within the unit cell. These points are then translated through lattice spacings only - no z shifts.
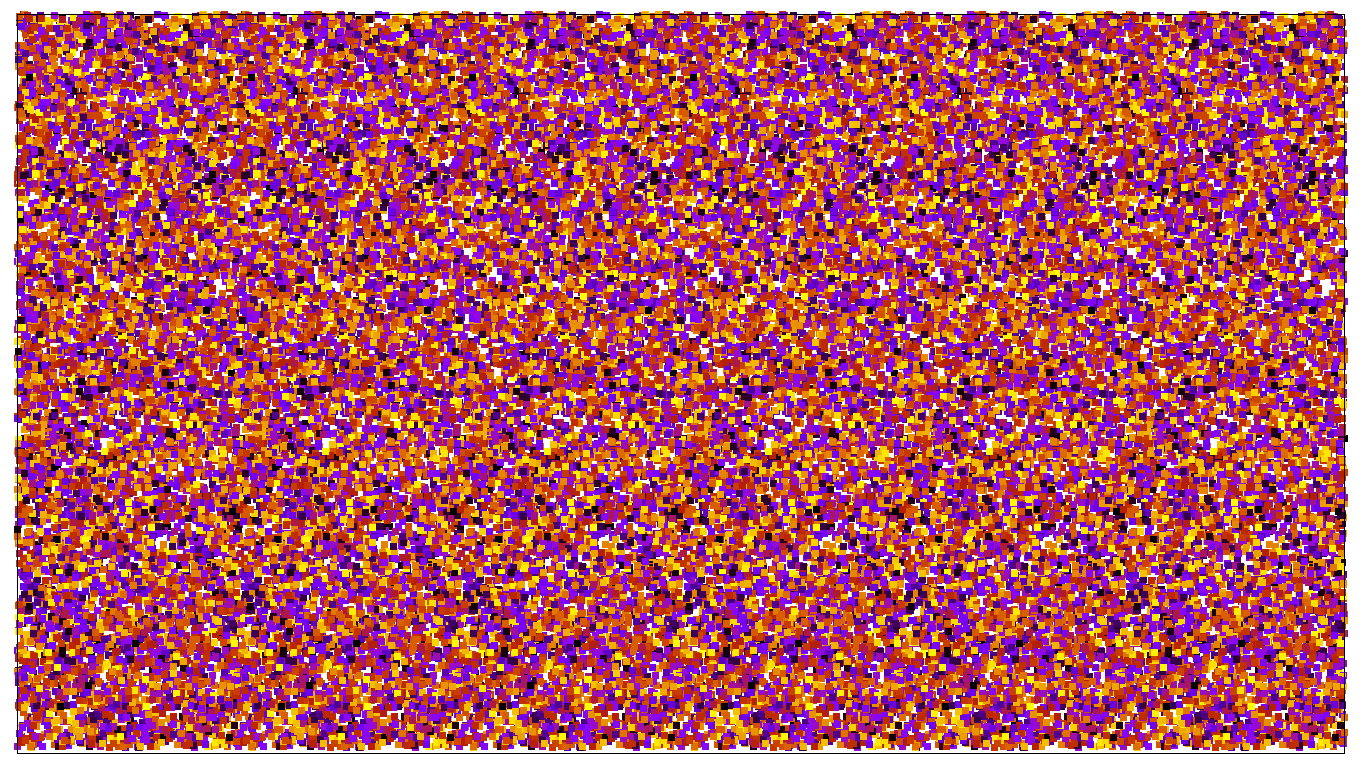
I have written a fortran 90 program to implement the algorithm, magick.f90, which is again included in the tarball. I also have the data files for the images at the top of the page. I can now reveal the popular corn-based snack to be a Pringle, and the mathematical knot to be a Stevedore. Both those choices of image were made because they are easy to parameterise mathematically: you have to be able to make a 3-column data file with x, y, and z locations. A pringle is a hyperbolic surface cut off at some radius, and a Stevedore knot is a Lissajous knot, meaning there's a simple parameteric expression for it. You can generate your own functions fairly easily. However, what would be better would be to take a picture off the internet and turn it into a 3D file. I have given some very basic idea how to do this in the next section.

Step 3: fancy extras
In this section I'll briefly outline one (very messy) method of taking a picture and turning it into a magick eye. This is very much into the programming side of things, and as I disclaimed at the start scientists including myself are terrible programmers.
First, find a picture. I'm assuming either an outline of a shape, such as this Walrus:
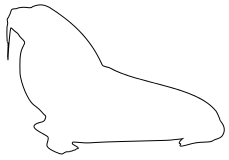
or a solid shape, such as this Walrus:

Open the file with Inkscape. This program is capable of saving files as point of view raytracing files with .pov extensions, for use with 3D animation software such as (Free and Open Source) POVray. Before saving your file as a .pov, use the node tool (F2) to see how many nodes run around the outside of the image. You need a fairly solid covering of nodes. It is instructive to look at the .svg files in Inkscape to see where the nodes are placed. Stripped down, a .pov file is a 2-column data file for the x and y co-ordinates of the nodes (hence the decent density needed) with some formatting. If we can strip the formatting and add some z-data we have the required format. A basic Unix shell script to do the appropriate stripping is provided in the tarball (pov2vec). The script expects a file called pic.pov as input. In the same folder type
>./pov2vec
to create a 2-column data file 'pic.dat'. Unfortunately only the outline will remain even if a solid walrus is used as input. So I've provided a second fortran program fill.f90 to fill the outline with points. The program requires you to specify the sources for ‘filling centres’, which shoot out points radially until the points hit the outline. To use it, first inspect pic.dat using GNUPlot. Have a think about where you'd like to place centres. Provided there's at least one, and they're all inside the outline, it should be okay. When you've altered the code appropriately, run it using
>gfortran fill.f90
>./a.out
to create 'picfull.dat', a filled-in version of your outline. Now you need to add the z-data. How you do this is really up to what picture you'd like to use. The method will always be to add a third column to your 2-column file, containing z(x,y) (a function of the first two columns). A simple program to do this, where you can edit the function z(x,y) to your liking, is 3d.f90 (again, included). Run it with
>gfortran 3d.f90
>./a.out
The program expects a 2-column data file ‘picfull.dat’, and outputs ‘pic3D.dat’. If you like the file (inspect it using GNUPlot's ‘splot’ function to plot it in 3D) rename it ‘in.dat’.
Finally run magick.f90 over ‘in.dat’ as before, to create ‘out.dat’, then use any plotting program (or the code supplied above for GNUPlot) to generate the image.
Super-fancy extras
A final complaint you may receive is that your magick eye autostereogram is just made up of squares, whereas the ones people remember from the early nineties were made of little pictures relating to the image which popped out. This is tricky to do in GNUPlot. If you've made it this far you're probably far better at coding than me, so I'll leave you to work out your own method of doing this. Alternatively I have provided an altered version of the main program, magick2.f90. This will create an ‘out.dat’ with a slightly different format. There's a second program, autoplot.f90, which is a program which takes in ‘out.dat’ and creates a third program ‘autoplot’. The third program, autoplot, assumes it is in a directory with a set of images [integer].png, and uses these in place of pixels. Here's an example, sticking to the nineties theme:
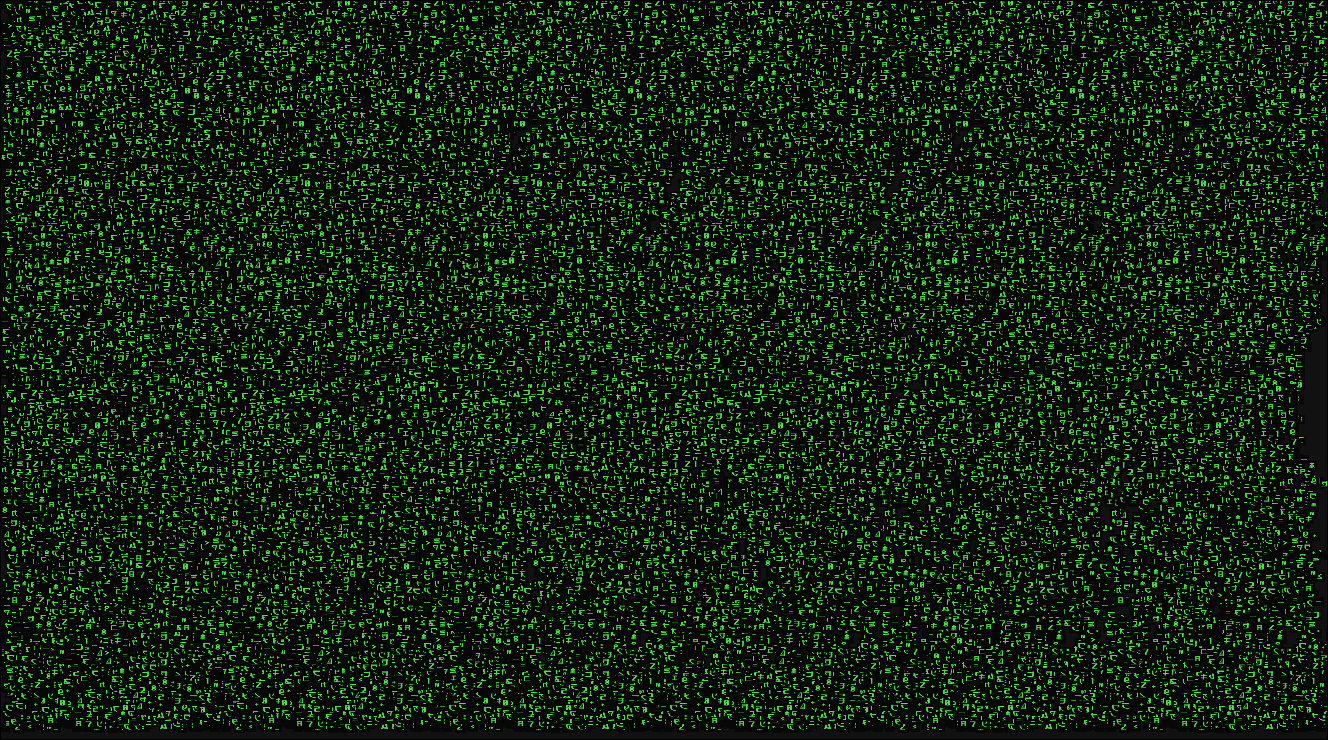
The Matrix images are included in a subfolder.
Summary
This article was meant to explain how autostereograms work, and how they are really a simple application of the ideas of crystallography, charge ordering, and Green's functions to generate a form of hologram (2D data encoding a 3D image). More information on all these topics is available on my research page.
I have included some code to produce them. I recommend writing your own; it'll probably end up being less work. Nevertheless, if you'd prefer to use mine, there's a README file included in the tarball which gives a very terse summary of what's written here. That is pretty much as follows:
Method 1 (you have access to a 3-column (x,y,z) data file 'in.dat'):
- download <magick.f90>
-
compile and run with
>gfortran magick.f90
>./a.out -
download GNUPlot program - run with
>gnuplot plot - you're done.
Method 2 (to make a magick eye from an available picture)
- find a picture file.
- Load in inkscape.
- Save as pic.pov
- run - you should have a file called pic.dat
- compile, placing centres as appropriate for the plot
- you should have a file called picfull.dat.
- use <3d.f90> to add z data of your choice
- compile and run to get a file called pic3D.dat
- rename it in.dat if you like it.
- Carry out Method 1.
Method 3 (to make an image with smaller images instead of pixels)
- Carry out Method 2, but subsitute the last step for this:
- download <magick2.f90>
- compile and run, creating out.dat
- download a set of picture files *.png, with * integers starting at 1
- download <autoplot.f90>
- compile and run to generate autoplot
- run with GNUPlot:
>gnuplot autoplot - You're done.